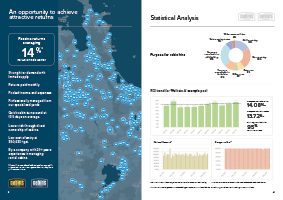
See how the Cabins To Go managed rental cabin investment has performed over time, including historic annualised returns and occupancy across our regional rental pools.
The chart below is based on the actual average returns for the Bay of Plenty pool*.
Roll over the chart to view the return for each month.
*Past performance does not guarantee future returns.
Historic performance provides useful context beyond a single headline return. By viewing results over a longer period, prospective investors can see how returns and occupancy have changed from month to month and gain a better understanding of the way the managed pool operates through different market conditions.
Under the Cabin Management Agreement, occupancy is measured by the number of cabins in the managed pool that are rented during the month. The Return on Investment Percentage is calculated by annualising an owner's monthly share of income against the original cost of their investment cabins.
The managed pool structure combines rental revenue and operating expenses across participating cabins. This helps spread the effect of individual cabins moving between hires, although income and occupancy will naturally vary over time. Learn more about how it works.
The charts and figures on this page show historical results only. They are intended to help prospective investors understand previous performance and should not be regarded as a forecast or guarantee of future returns.
If you would like to explore what these returns could mean at different investment levels, try our Cabin Investment Calculator.